
Joseph Manu
Fullback
Player Bio
- Height:
- 192 cm
- Date of Birth:
- 29 June 1996
- Weight:
- 98 kg
- Birthplace:
- Hamilton, NZ
- Age:
- 28
- Nickname:
- Joey
- Debut Club:
- Sydney Roosters
- Date:
- 19 June 2016
- Opposition:
- New Zealand Warriors
- Round:
- 15
- Previous Club:
- -
- Junior Club:
- Tokoroa High School
- Biography:
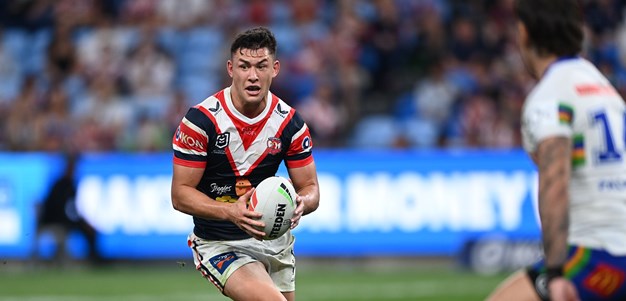
A two-time Premiership winner, New Zealand Kiwis representative, Māori All Star and a Sydney Roosters centurion, Joseph Manu (Rooster no.1162) has been a proven performer in Trent Robinson's side since his NRL debut in 2016.
At 27, Manu is regarded as one of the most naturally talented outside backs in the competition with his natural flair and daring in attack, and is able to play in the centres, at fullback and in the halves at a pinch.
Career
- Appearances
- 181
- Tries
- 69
2024 Season
- Appearances
- 23
Scoring
- Tries
- 10
Attack
- Try Assists
- 9
- Line Breaks
- 10
- Tackle Breaks
- 104
Passing
- Receipts
- 498
Defence
- Tackles Made
- 357
- Missed Tackles
- 58
- Tackle Efficiency
-
Running Metres
- Average Running Metres
- 126
- Total Running Metres
- 2910
Fantasy
- Total Points
- 1045
- Average Points
- 45.4
2024 Season - By Round
| Round | Opponent | Score | Position | Minutes Played | Tries | Goals | 1 Point Field Goals | 2 Point Field Goals | Points | Kicking Metres | Forced Drop Outs | Try Assists | Linebreaks | Tackle Breaks | Post Contact Metres | Offloads | Receipts | Tackles Made | Missed Tackles | Total Running Metres | Hit Up Running Metres | Kick Return Metres | |
|---|---|---|---|---|---|---|---|---|---|---|---|---|---|---|---|---|---|---|---|---|---|---|---|
| 1 | Broncos | Won | 20 - 10 | Centre | 80 | 1 | - | - | - | 4 | 1 | - | 1 | - | 5 | 46 | 3 | 26 | 17 | 4 | 165 | - | - |
| 2 | Sea Eagles | Lost | 21 - 14 | Centre | 80 | - | - | - | - | - | - | - | - | - | 1 | 29 | - | 15 | 11 | 4 | 86 | - | - |
| 3 | Rabbitohs | Won | 48 - 6 | Centre | 80 | 2 | - | - | - | 8 | - | - | - | 1 | 2 | 31 | - | 15 | 17 | 5 | 108 | - | - |
| 4 | Panthers | Lost | 16 - 22 | Centre | 80 | - | - | - | - | - | 10 | - | - | - | 10 | 37 | 2 | 22 | 18 | - | 104 | - | - |
| 5 | Bulldogs | Lost | 30 - 26 | Centre | 80 | 1 | - | - | - | 4 | 58 | - | - | 1 | 8 | 57 | 3 | 33 | 6 | 2 | 169 | 20 | 43 |
| 6 | Knights | Won | 20 - 22 | Fullback | 80 | - | - | - | - | - | 60 | 1 | 1 | - | 11 | 137 | 1 | 45 | 5 | 2 | 347 | - | 116 |
| 7 | Storm | Lost | 12 - 18 | Centre | 80 | 1 | - | - | - | 4 | - | - | - | 1 | 4 | 26 | 2 | 20 | 21 | 3 | 103 | 9 | - |
| 8 | Dragons | Won | 18 - 60 | Centre | 80 | 2 | - | - | - | 8 | 17 | - | 1 | 1 | 4 | 44 | 1 | 26 | 16 | 2 | 150 | - | 3 |
| 9 | Broncos | Won | 18 - 40 | Centre | 80 | 1 | - | - | - | 4 | 11 | - | - | 1 | 6 | 34 | 3 | 16 | 21 | 4 | 101 | - | - |
| 10 | Warriors | Won | 38 - 18 | Centre | 80 | - | - | - | - | - | - | - | 1 | 1 | - | 26 | 2 | 22 | 21 | 5 | 83 | - | - |
| 12 | Raiders | Won | 16 - 44 | Centre | 80 | 2 | - | - | - | 8 | - | - | - | 2 | 4 | 51 | - | 15 | 17 | 1 | 173 | - | - |
| 13 | Cowboys | Lost | 16 - 18 | Fullback | 80 | - | - | - | - | - | 23 | - | - | - | 10 | 63 | - | 44 | 7 | 2 | 202 | 12 | 58 |
| 15 | Eels | Won | 18 - 28 | Centre | 80 | - | - | - | - | - | - | - | 1 | - | 1 | 24 | 1 | 14 | 18 | - | 58 | - | 3 |
| 16 | Bulldogs | Won | 26 - 8 | Centre | 80 | - | - | - | - | - | - | - | - | 1 | 6 | 32 | - | 17 | 16 | 3 | 98 | - | - |
| 17 | Wests Tigers | Won | 40 - 6 | Centre | 29 | - | - | - | - | - | - | - | 1 | - | 4 | 24 | 1 | 11 | 7 | - | 69 | - | - |
| 22 | Dolphins | Won | 34 - 40 | Centre | 70 | - | - | - | - | - | - | - | - | - | 5 | 36 | - | 15 | 16 | 1 | 70 | 9 | - |
| 24 | Eels | Won | 38 - 14 | Centre | 80 | - | - | - | - | - | 25 | 1 | 2 | 1 | 3 | 38 | 2 | 16 | 14 | 4 | 119 | - | - |
| 25 | Titans | Won | 22 - 48 | Centre | 80 | - | - | - | - | - | - | - | - | - | 1 | 39 | - | 11 | 21 | 4 | 112 | - | - |
| 26 | Raiders | Lost | 12 - 14 | Centre | 80 | - | - | - | - | - | 36 | - | - | - | 8 | 48 | 4 | 42 | 21 | 4 | 195 | 8 | - |
| 27 | Rabbitohs | Won | 28 - 36 | Centre | 80 | - | - | - | - | - | - | - | - | - | - | 35 | - | 17 | 21 | 1 | 91 | - | - |
| 28 | Panthers | Lost | 30 - 10 | Centre | 80 | - | - | - | - | - | - | - | - | - | 3 | 38 | - | 23 | 17 | 3 | 111 | 18 | - |
| 29 | Sea Eagles | Won | 40 - 16 | Centre | 80 | - | - | - | - | - | - | - | 1 | - | 5 | 37 | 4 | 16 | 10 | 2 | 111 | - | - |
| 30 | Storm | Lost | 48 - 18 | Centre | 80 | - | - | - | - | - | - | - | - | - | 3 | 24 | 1 | 17 | 19 | 2 | 75 | - | - |
Career By Season
| Year | Played | Won | Lost | Drawn | Win % | Tries | Goals | 1 Point Field Goals | 2 Point Field Goals | Points | Kicking Metres | Kicking Metres Average | Goal Conversion Rate | Forced Drop Outs | Try Assists | Linebreaks | Receipts | Tackles Made | Missed Tackles | Tackle Efficiency | Total Running Metres | Average Running Metres | Kick Return Metres | Total Points | Average Points | |
|---|---|---|---|---|---|---|---|---|---|---|---|---|---|---|---|---|---|---|---|---|---|---|---|---|---|---|
| Roosters | 2016 | 3 | - | 3 | - | - | - | - | - | - | - | 16 | 5.40 | - | 1 | - | - | 53 | 16 | 3 | 92.30% | 382 | 127.00 | 94 | 75 | 25.0 |
| Roosters | 2017 | 16 | 12 | 4 | - | 75% | 5 | - | - | - | 20 | 50 | 3.13 | - | - | 4 | 7 | 190 | 206 | 43 | 82.73% | 1,328 | 83.00 | 54 | 432 | 27.0 |
| Roosters | 2018 | 26 | 19 | 7 | - | 73% | 8 | - | - | - | 32 | 11 | 0.42 | - | - | 9 | 10 | 304 | 338 | 46 | 88.02% | 2,276 | 87.00 | 46 | 852 | 32.8 |
| Roosters | 2019 | 25 | 18 | 7 | - | 72% | 8 | - | - | - | 32 | 84 | 3.35 | - | - | 5 | 8 | 368 | 338 | 61 | 84.71% | 2,561 | 102.00 | 315 | 839 | 33.6 |
| Roosters | 2020 | 21 | 14 | 7 | - | 67% | 9 | - | - | - | 36 | 161 | 7.66 | - | 1 | 5 | 9 | 323 | 360 | 52 | 87.38% | 2,275 | 108.00 | 262 | 882 | 42.0 |
| Roosters | 2021 | 23 | 15 | 8 | - | 65% | 10 | - | - | - | 40 | 390 | 16.97 | - | 1 | 7 | 12 | 561 | 317 | 57 | 84.76% | 3,253 | 141.00 | 337 | 1,085 | 47.2 |
| Roosters | 2022 | 23 | 14 | 9 | - | 61% | 11 | - | - | - | 44 | 171 | 7.43 | - | 2 | 12 | 13 | 485 | 332 | 63 | 84.05% | 3,242 | 140.00 | 172 | 1,174 | 51.0 |
| Roosters | 2023 | 21 | 12 | 9 | - | 57% | 8 | - | - | - | 32 | 486 | 23.14 | - | 4 | 5 | 7 | 501 | 363 | 79 | 82.13% | 2,908 | 138.00 | 246 | 970 | 46.2 |
| Roosters | 2024 | 23 | 15 | 8 | - | 65% | 10 | - | - | - | 40 | 240 | 10.45 | - | 2 | 9 | 10 | 498 | 357 | 58 | 86.02% | 2,910 | 126.00 | 224 | 1,045 | 45.4 |
Career Overall
| Year Start | Year End | Played | Won | Lost | Drawn | Win % | Tries | Goals | 1 Point Field Goals | 2 Point Field Goals | Points | Kicking Metres | Kicking Metres Average | Goal Conversion Rate | Forced Drop Outs | Try Assists | Linebreaks | Receipts | Tackles Made | Missed Tackles | Tackle Efficiency | Total Running Metres | Average Running Metres | Kick Return Metres | Total Points | Average Points | |
|---|---|---|---|---|---|---|---|---|---|---|---|---|---|---|---|---|---|---|---|---|---|---|---|---|---|---|---|
| Roosters | 2016 | 2024 | 181 | 119 | 62 | - | 66% | 69 | - | - | - | 276 | 1,620 | 8.90 | - | 11 | 56 | 76 | 3,283 | 2,627 | 462 | 85.04% | 21,139 | 116.00 | 1,754 | 7,354 | 40.6 |
Latest
Team Mates

Sydney Roosters respect and honour the Traditional Custodians of the land and pay our respects to their Elders past, present and future. We acknowledge the stories, traditions and living cultures of Aboriginal and Torres Strait Islander peoples on the lands we meet, gather and play on.


